

General questions
What is Basedash?
What is Basedash?
Basedash is an AI-native business intelligence platform that lets you
create beautiful charts and dashboards using natural language. Instead of
writing SQL queries or using complex chart builders, you can simply describe
what you want to see in plain English.
How does Basedash differ from traditional BI tools?
How does Basedash differ from traditional BI tools?
Basedash uses AI to handle the technical aspects of data analysis, allowing you to:
- Create charts using natural language
- Chat with your data to get insights
- Get instant visualizations without manual configuration
- Collaborate with your team easily
Is Basedash secure?
Is Basedash secure?
Yes, Basedash takes security seriously. We are SOC 2 Type II compliant and
implement comprehensive security measures. For more details, see our
security documentation.
Getting started
How do I get started with Basedash?
How do I get started with Basedash?
- Sign up for an account
- Connect your data sources
- Start creating charts using natural language
- Invite your team to collaborate
What data sources can I connect to?
What data sources can I connect to?
Basedash supports a wide range of data sources including:
- SQL databases (PostgreSQL, MySQL, etc.)
- Data warehouses (BigQuery, Snowflake, etc.)
- 750+ SaaS connectors through Fivetran, synced into Basedash Warehouse
- Google Sheets and Google Drive
Do I need technical expertise to use Basedash?
Do I need technical expertise to use Basedash?
No, Basedash is designed to be useful for even non-technical teammates. You
can create charts and analyze data using natural language, without needing
to write SQL or understand complex data structures. Database and technical
knowledge are helpful in understanding more complex requests and charts, but
it’s not a requirement.
Can I try Basedash before committing?
Can I try Basedash before committing?
Yes, you can sign up for a 14-day free trial to explore Basedash’s features
and see if it’s right for your needs. If you need more time, you can contact
us to extend the trial.
Features
How does the AI chart creation work?
How does the AI chart creation work?
Simply describe what you want to see in plain English, and Basedash’s AI will:
- Understand your request
- Write the appropriate SQL query
- Choose the best visualization type
- Format the chart appropriately
Can I customize the charts?
Can I customize the charts?
Yes, you can customize various aspects of your charts including:
- Chart types
- Data formatting
- Labels and titles
How do I create a variable or filter?
How do I create a variable or filter?
Ask for charts in open-ended terms, like “revenue over time” or “sales by
region”, and Basedash adds the matching filters for you. See Filters and
variables for the filter types and how to
edit them.
How can I be confident that the data in chats isn't hallucinated?
How can I be confident that the data in chats isn't hallucinated?
Every number in a chat answer comes from a SQL query that Basedash runs
against your data, not from the AI’s memory. Open Sources under an
answer to see each query’s SQL and results. Basedash also runs internal
evaluations with every new AI model release to check error rates. See
Accuracy and trust for how answers are
generated and how to check them.
Is Basedash read-only or can it edit data?
Is Basedash read-only or can it edit data?
The AI is read-only by default. On Postgres, Redshift, and Supabase, people
with Can edit access to a data source can ask chat to make a change,
and the AI proposes a single
INSERT, UPDATE, or DELETE statement that
only runs after they approve it. To rule out changes completely, connect
with a read-only database user. See Accuracy and
trust.How can I restrict access to data?
How can I restrict access to data?
Admins can use data source access
control to choose who can
view or edit each data source, and hide specific schemas, tables, or
columns from members and groups. Row-level
security limits which rows each user
sees. You can also share individual dashboards only with specific
groups, such as a dashboard only your support
team can open.On the Enterprise plan, we also support SAML SSO,
allowing you to manage user authentication through your existing identity
provider.
Data management
How do I restore archived or deleted charts?
How do I restore archived or deleted charts?
Open the Charts page, click the filter dropdown next to the search box
(it shows All charts by default), and choose Recently deleted.
Charts are permanently deleted after 30 days.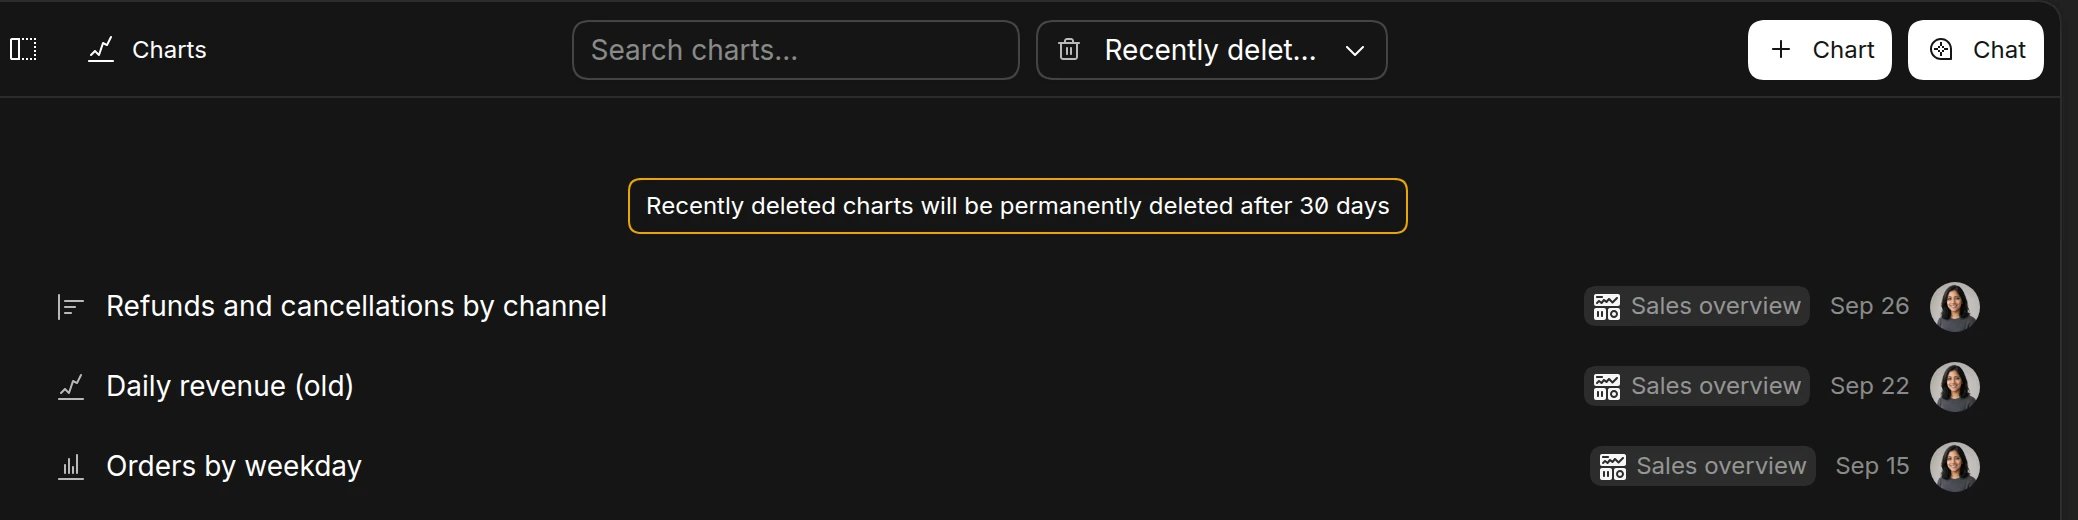
How do I restore archived or deleted dashboards?
How do I restore archived or deleted dashboards?
In the sidebar, click the Filter button next to the Dashboards
heading and choose Recently deleted. The sidebar then lists your
deleted dashboards. Dashboards are permanently deleted after 30 days.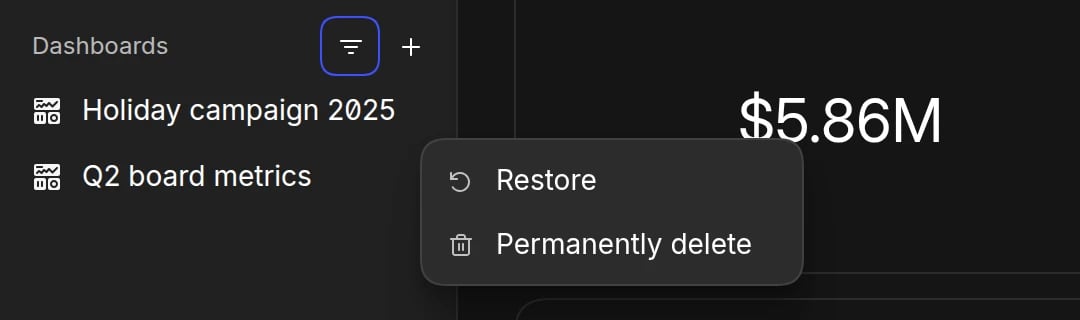
Can I restore deleted chats?
Can I restore deleted chats?
No, deleted chats cannot be restored. Once a chat is deleted, it’s
permanently removed from the system.
How do I export data from my queries?
How do I export data from my queries?
From charts: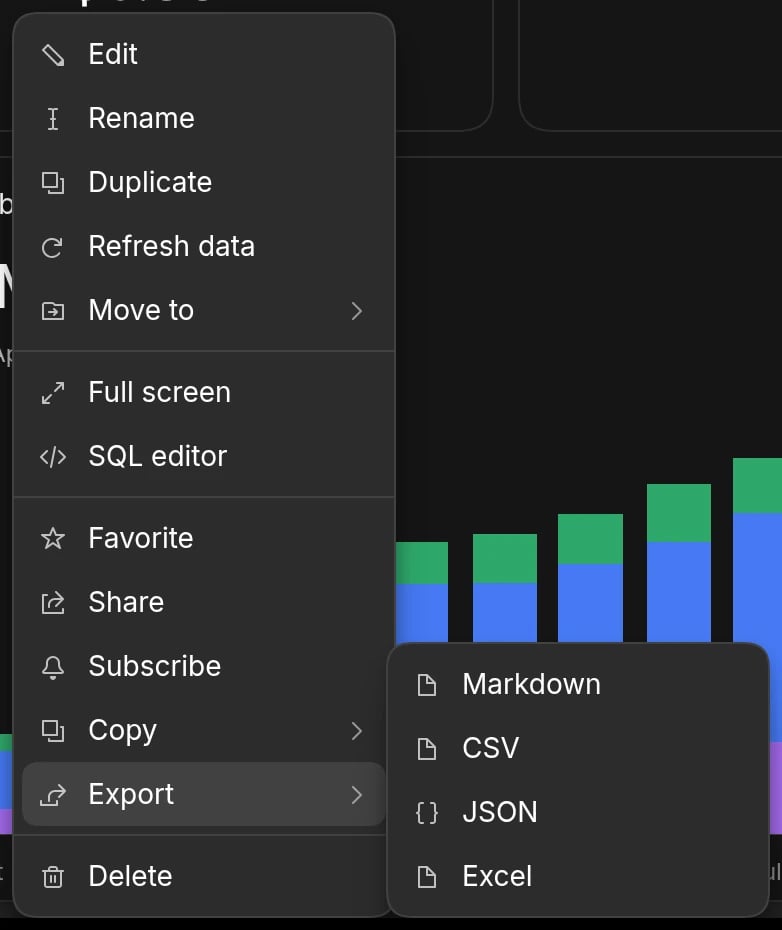
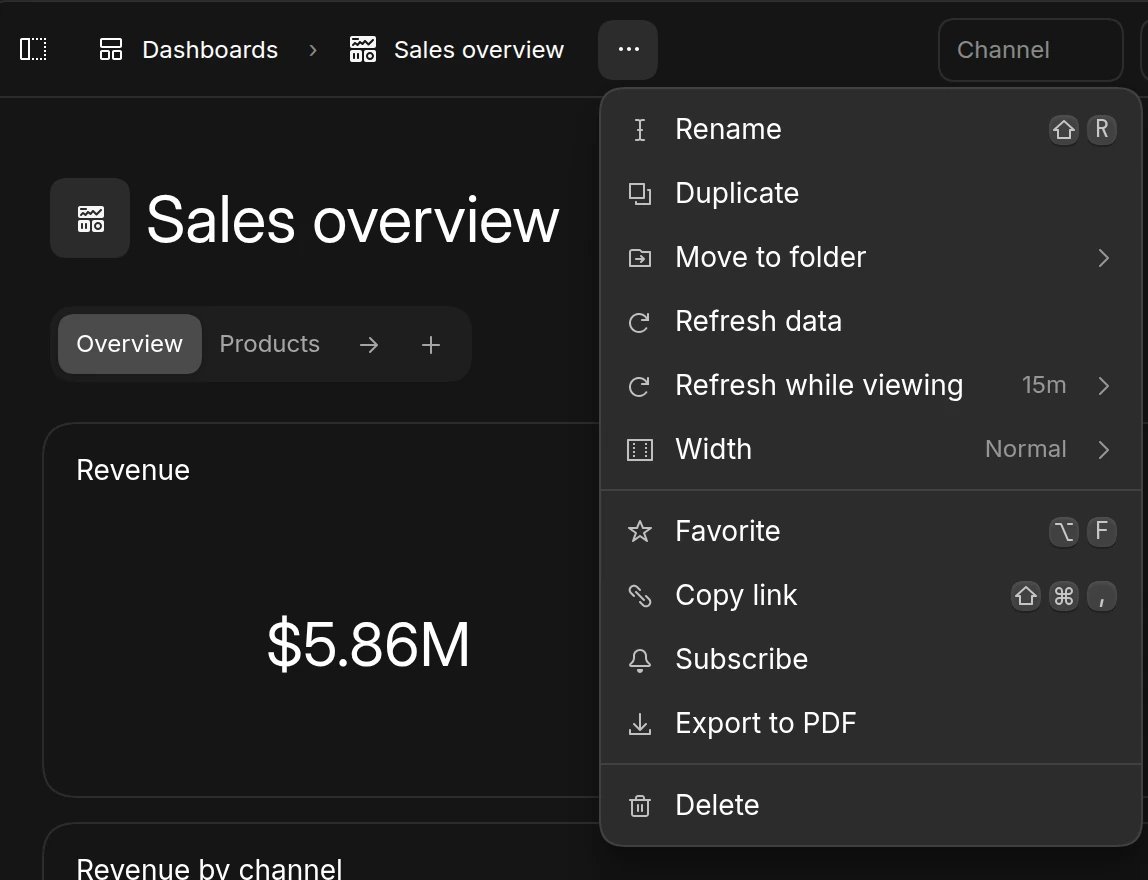
- Right-click on any chart and select Export to choose between Markdown, CSV, JSON, or Excel formats
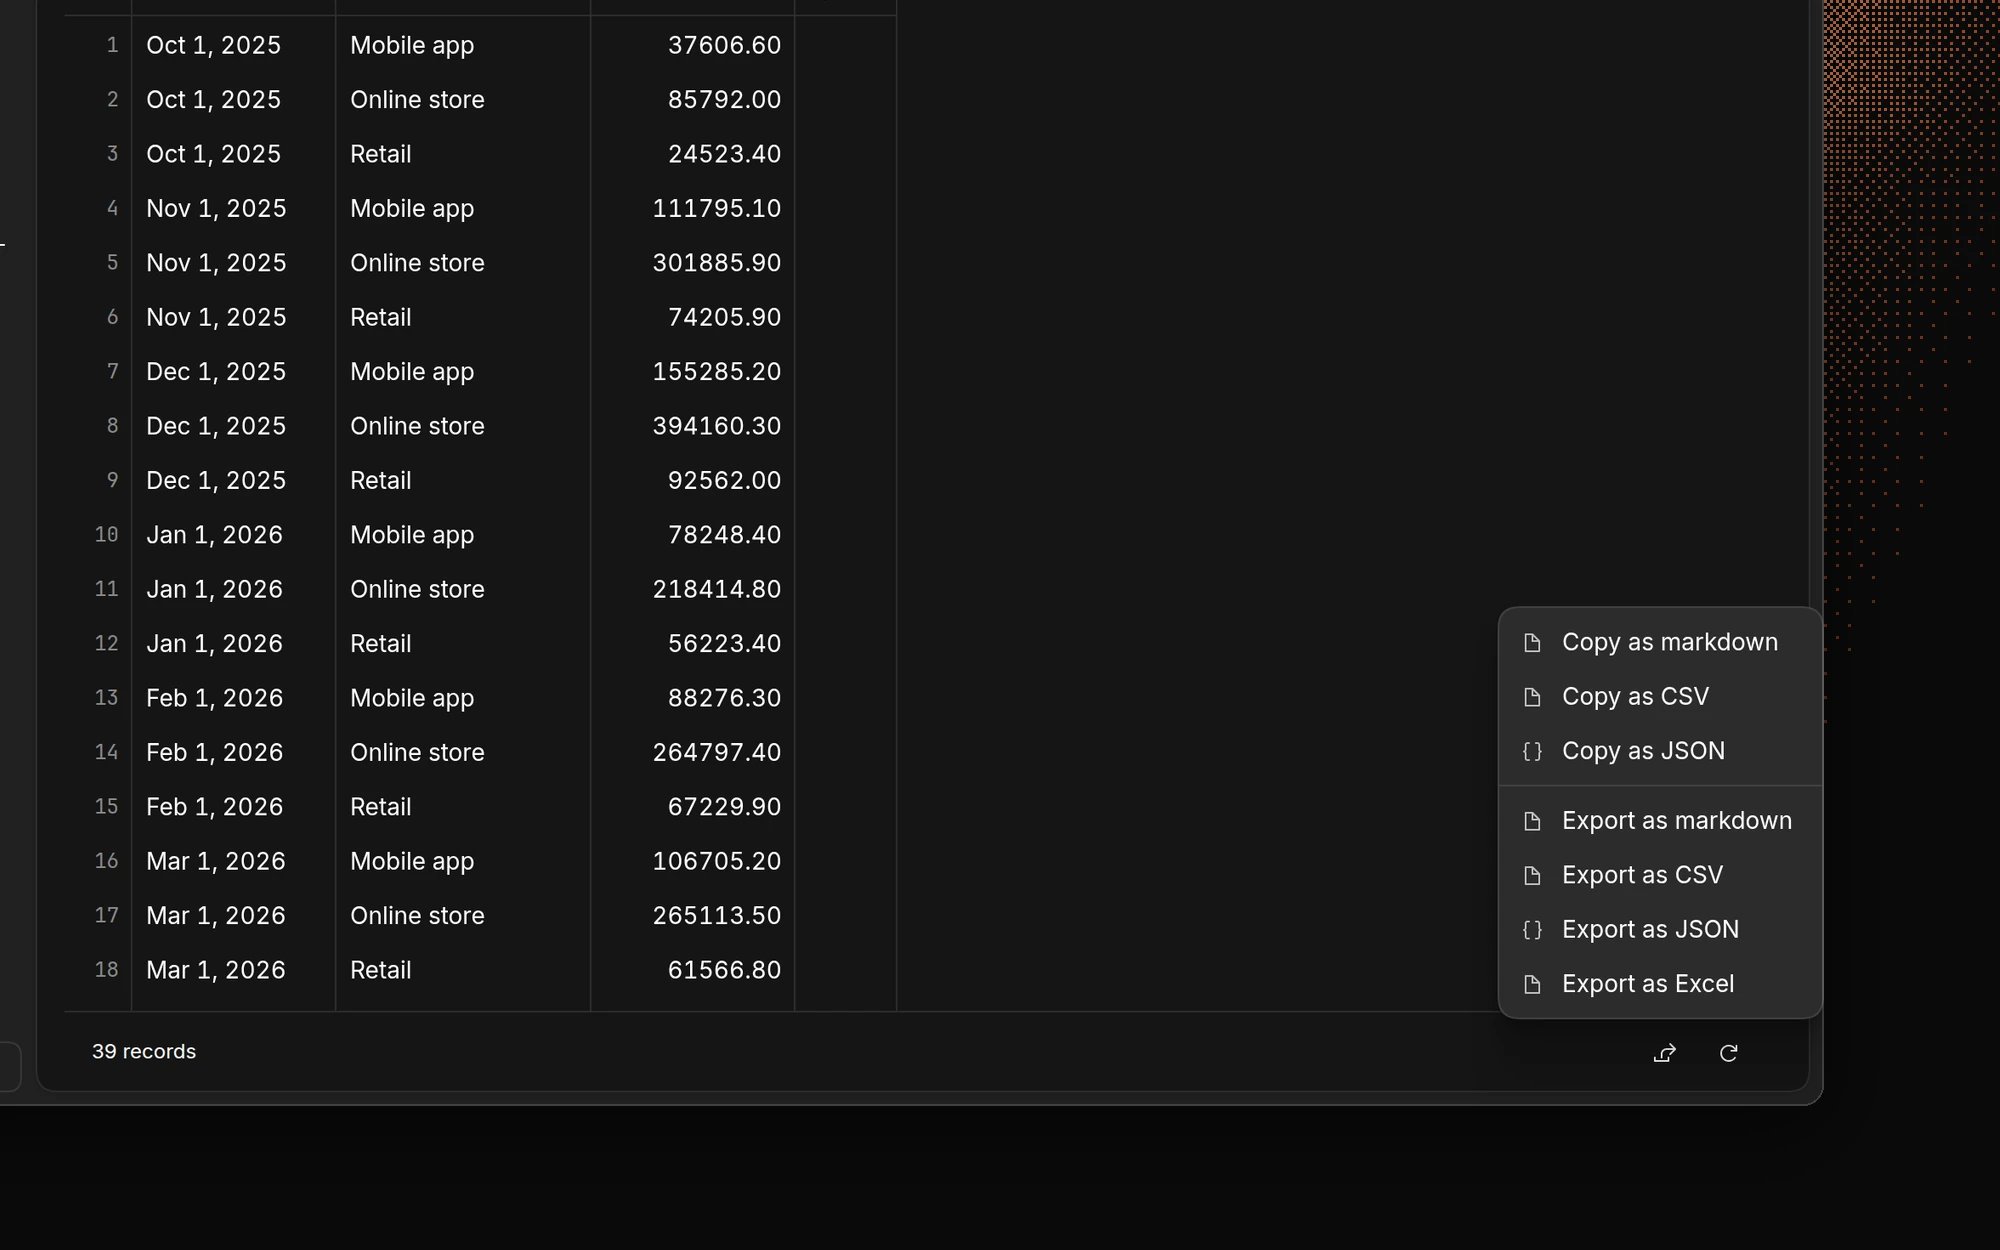
- Open a chart, go to the Response tab, and click the export button in the bottom right corner of the footer
- Go to the Data page and select the export button in the footer of the data tables
- Click the overflow menu (three dots) next to the dashboard name in the header
- Select Export to PDF to export the entire dashboard
Can I upload my own CSVs of data?
Can I upload my own CSVs of data?
Yes, you can attach files to a chat and ask questions
about them. Supported files include CSV and TSV, Excel, PDF, Word,
PowerPoint, JSON, text, and images, up to 50 MB per message.Attached files are only available in that chat. To use a file as a table
across charts and dashboards, connect a file storage service like Google
Drive,
Dropbox, Google
Sheets,
OneDrive, and Azure Blob
Storage. If a CSV is in the
folder you connect, it will be shown and used as a table within Basedash
under that connection.
Is there a limit to how much data I can analyze?
Is there a limit to how much data I can analyze?
Basedash can handle large datasets, but specific limits depend on your plan
and data source. Contact us for specific details about your use case.
Support
How can I get help?
How can I get help?
- Read the Troubleshooting guide and the FAQ on each feature page - Email support at support@basedash.com